Business Intelligence Solutions Tailored for You
Transform your data into actionable insights with our expert software development services.
Rated 5 stars by clients.
★★★★★
Unlock the full potential of your business data with Business Metrics’ advanced solutions tailored to meet your specific needs. From predictive analytics to intuitive dashboards, we provide the tools to drive informed decision-making and maximize the value of your data assets.

150+
15
Trusted by Clients
Proven Expertise
Bespoke Software Solutions
We provide tailored business intelligence software, including dashboards, analytics, and consulting for unique needs.
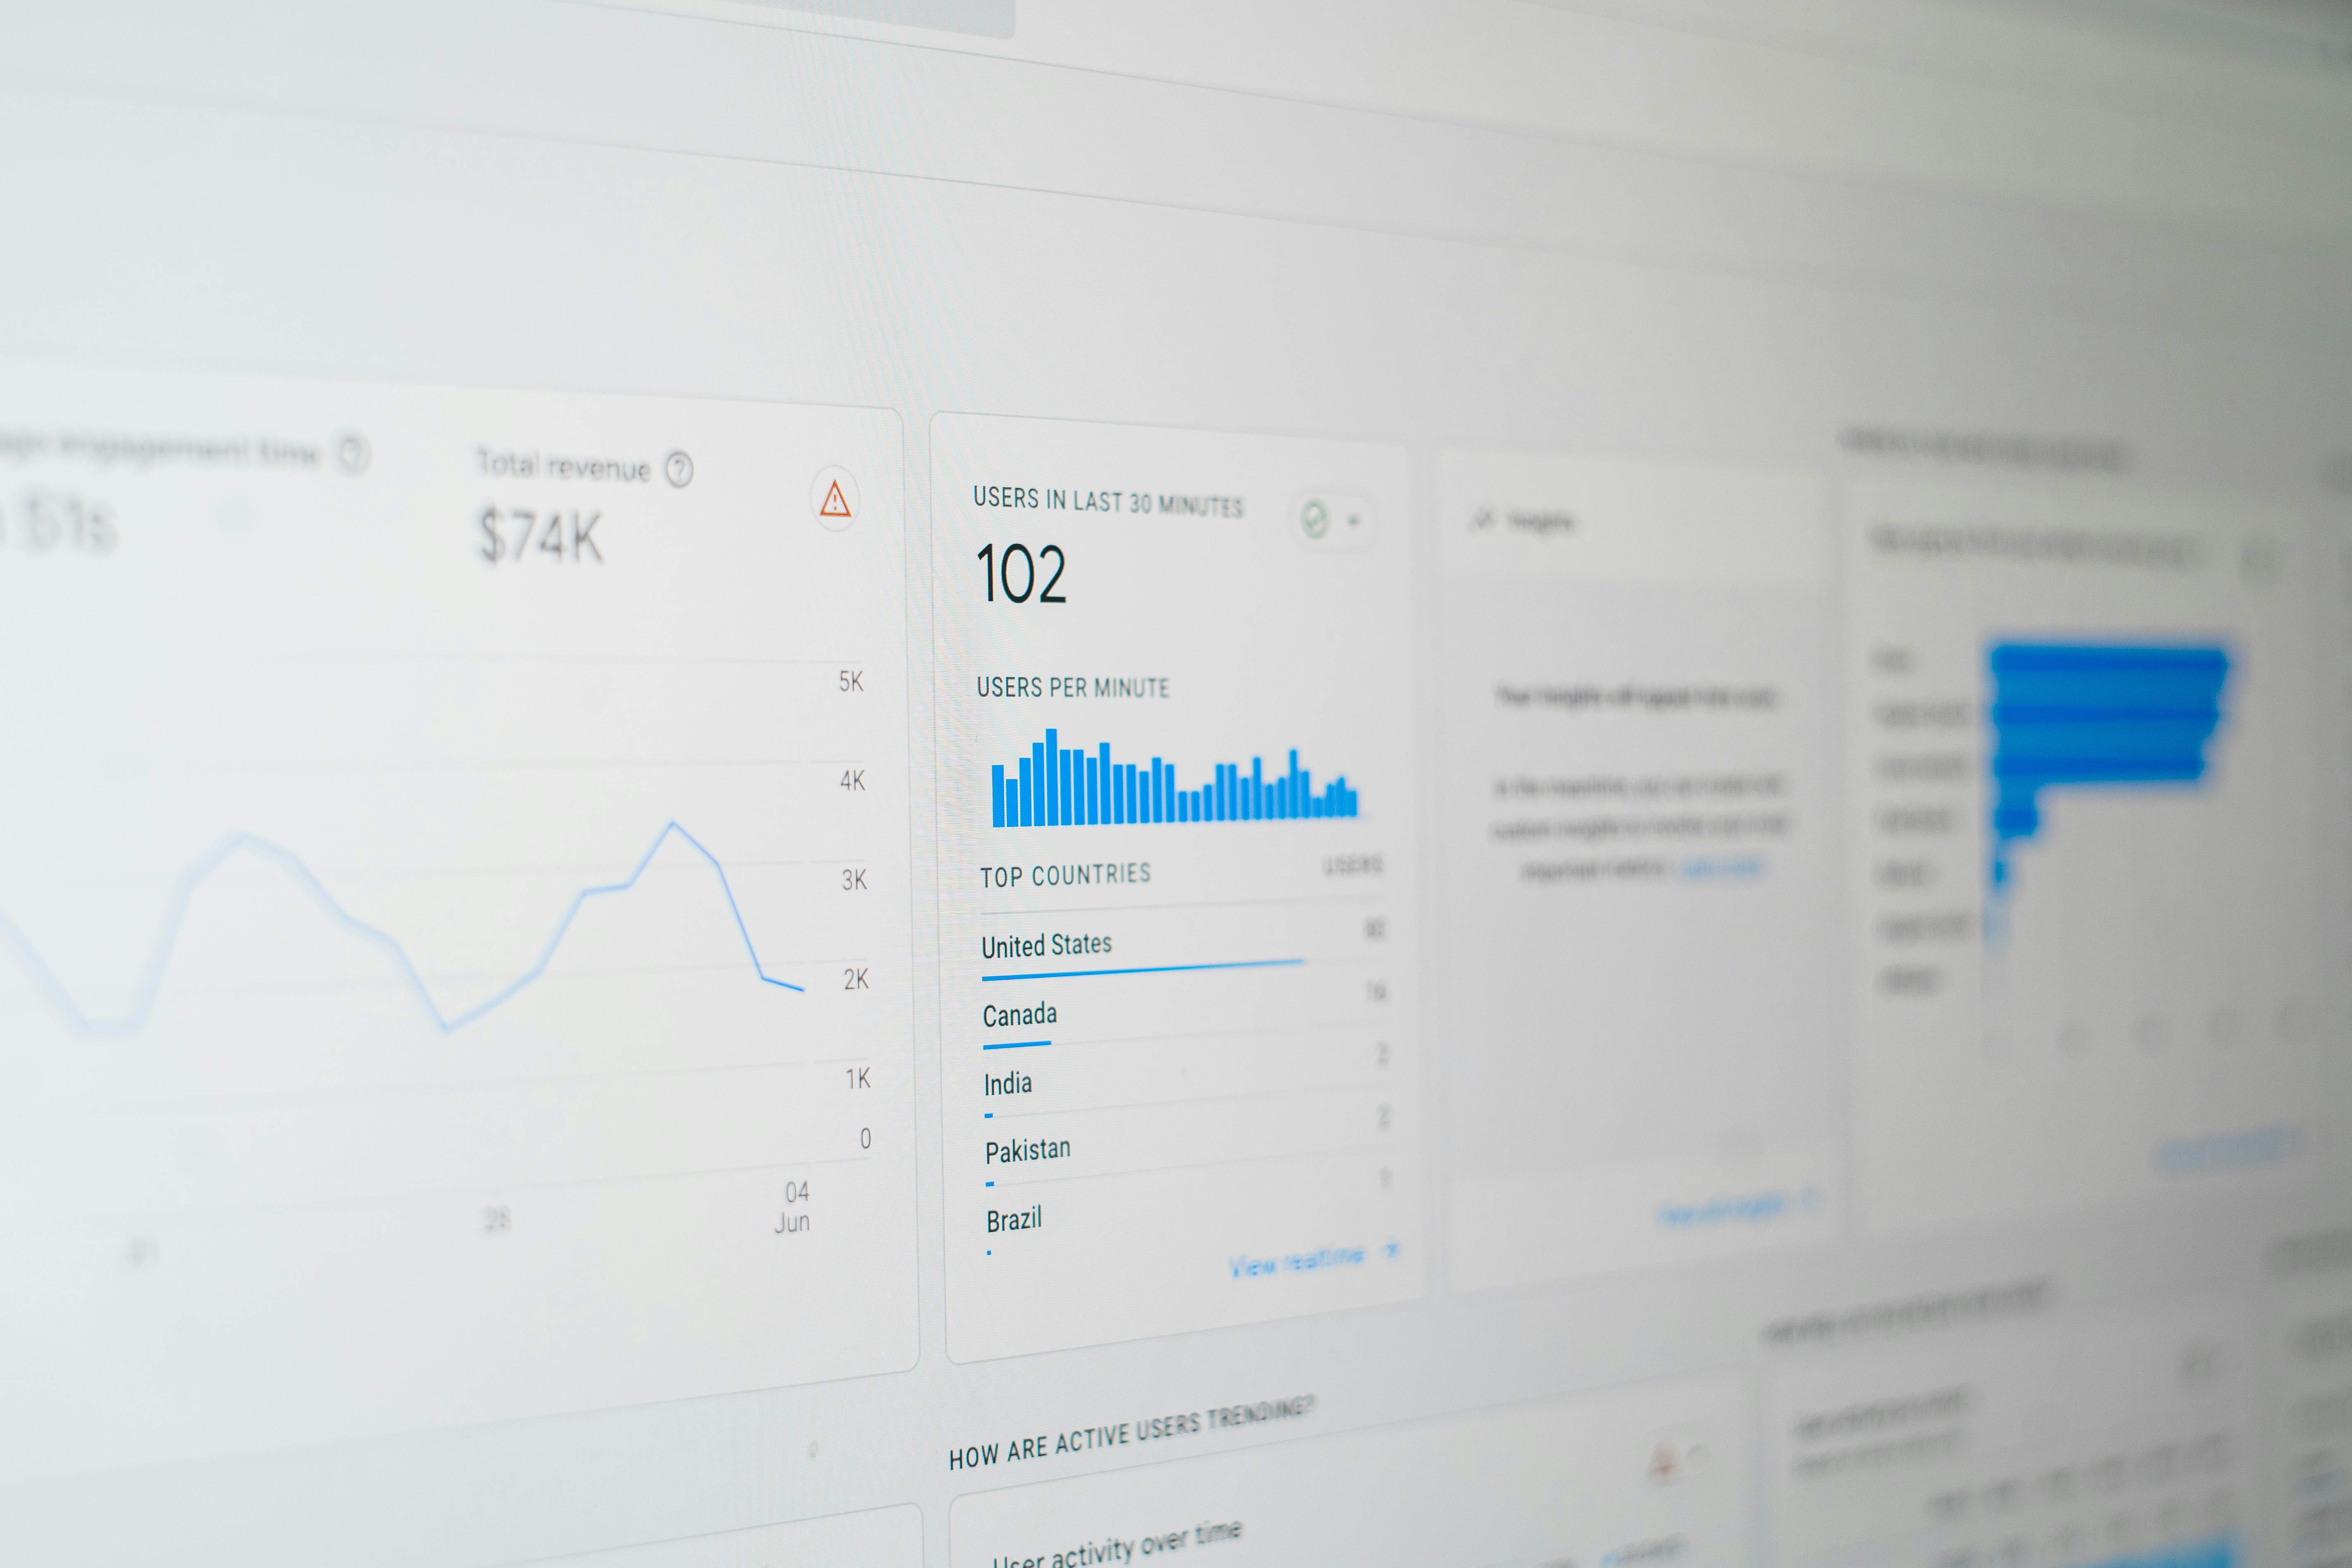
Data Analytics Experts
Our team specializes in data analysis, helping businesses make informed decisions through actionable insights.

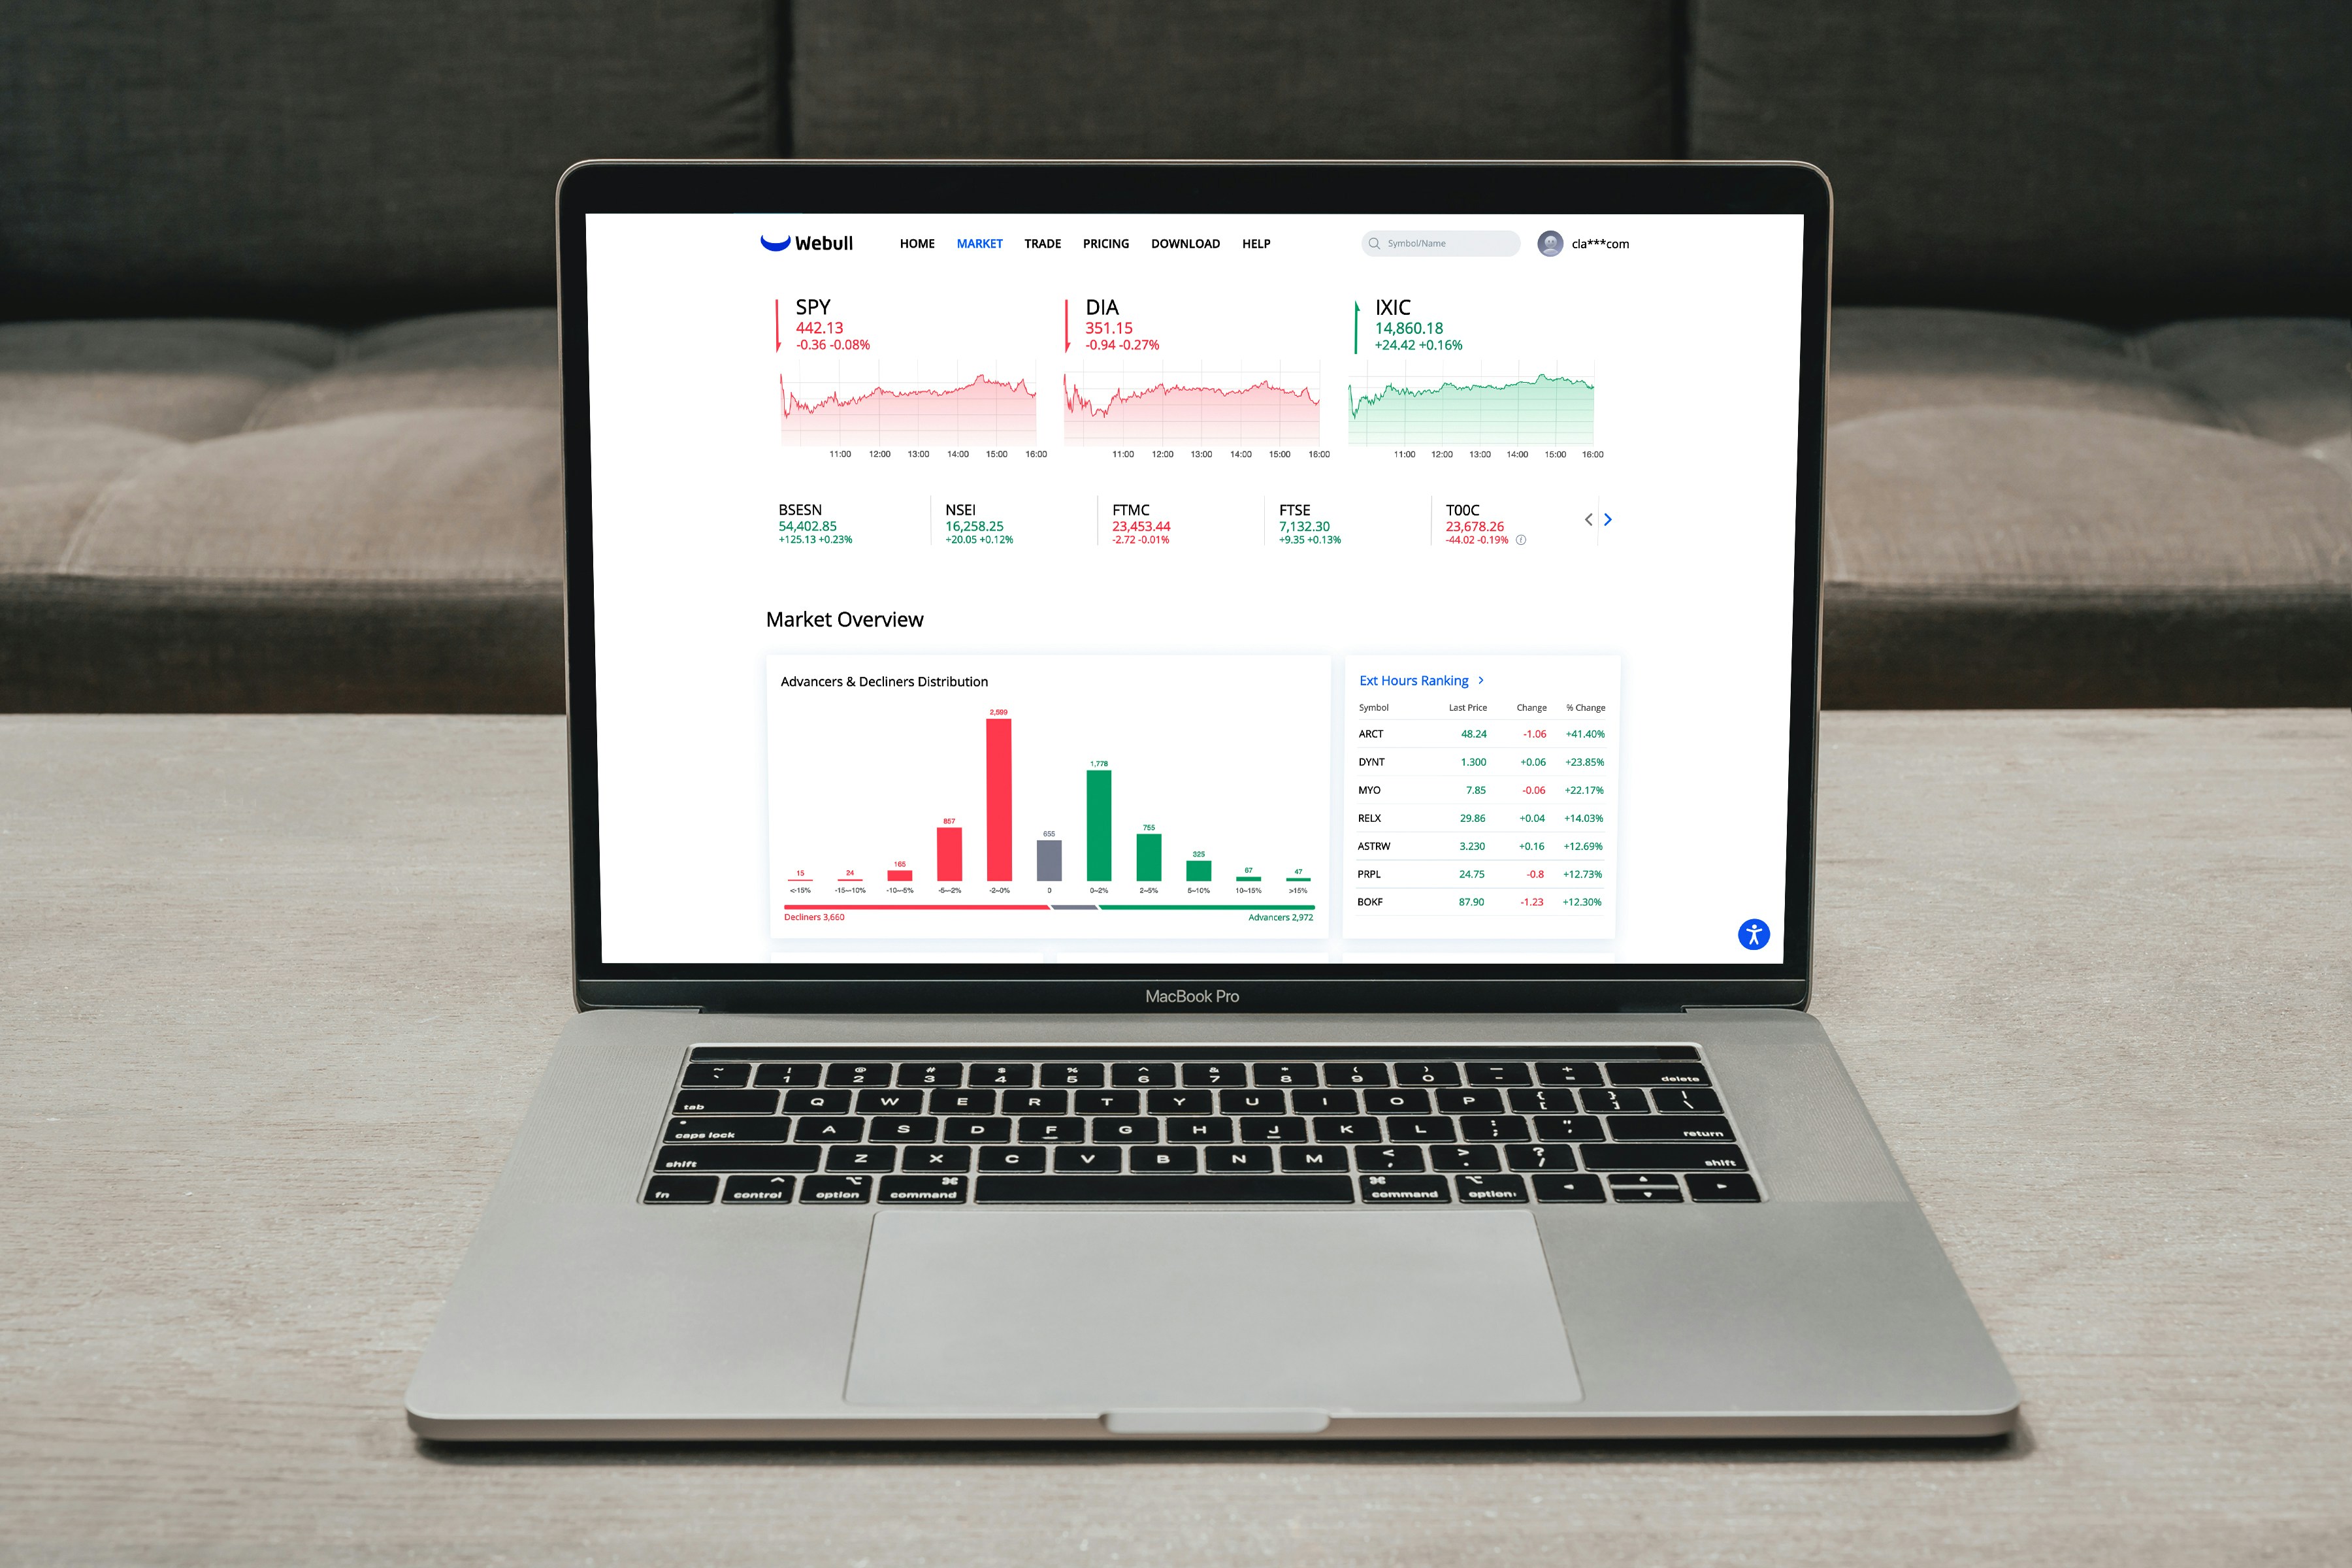
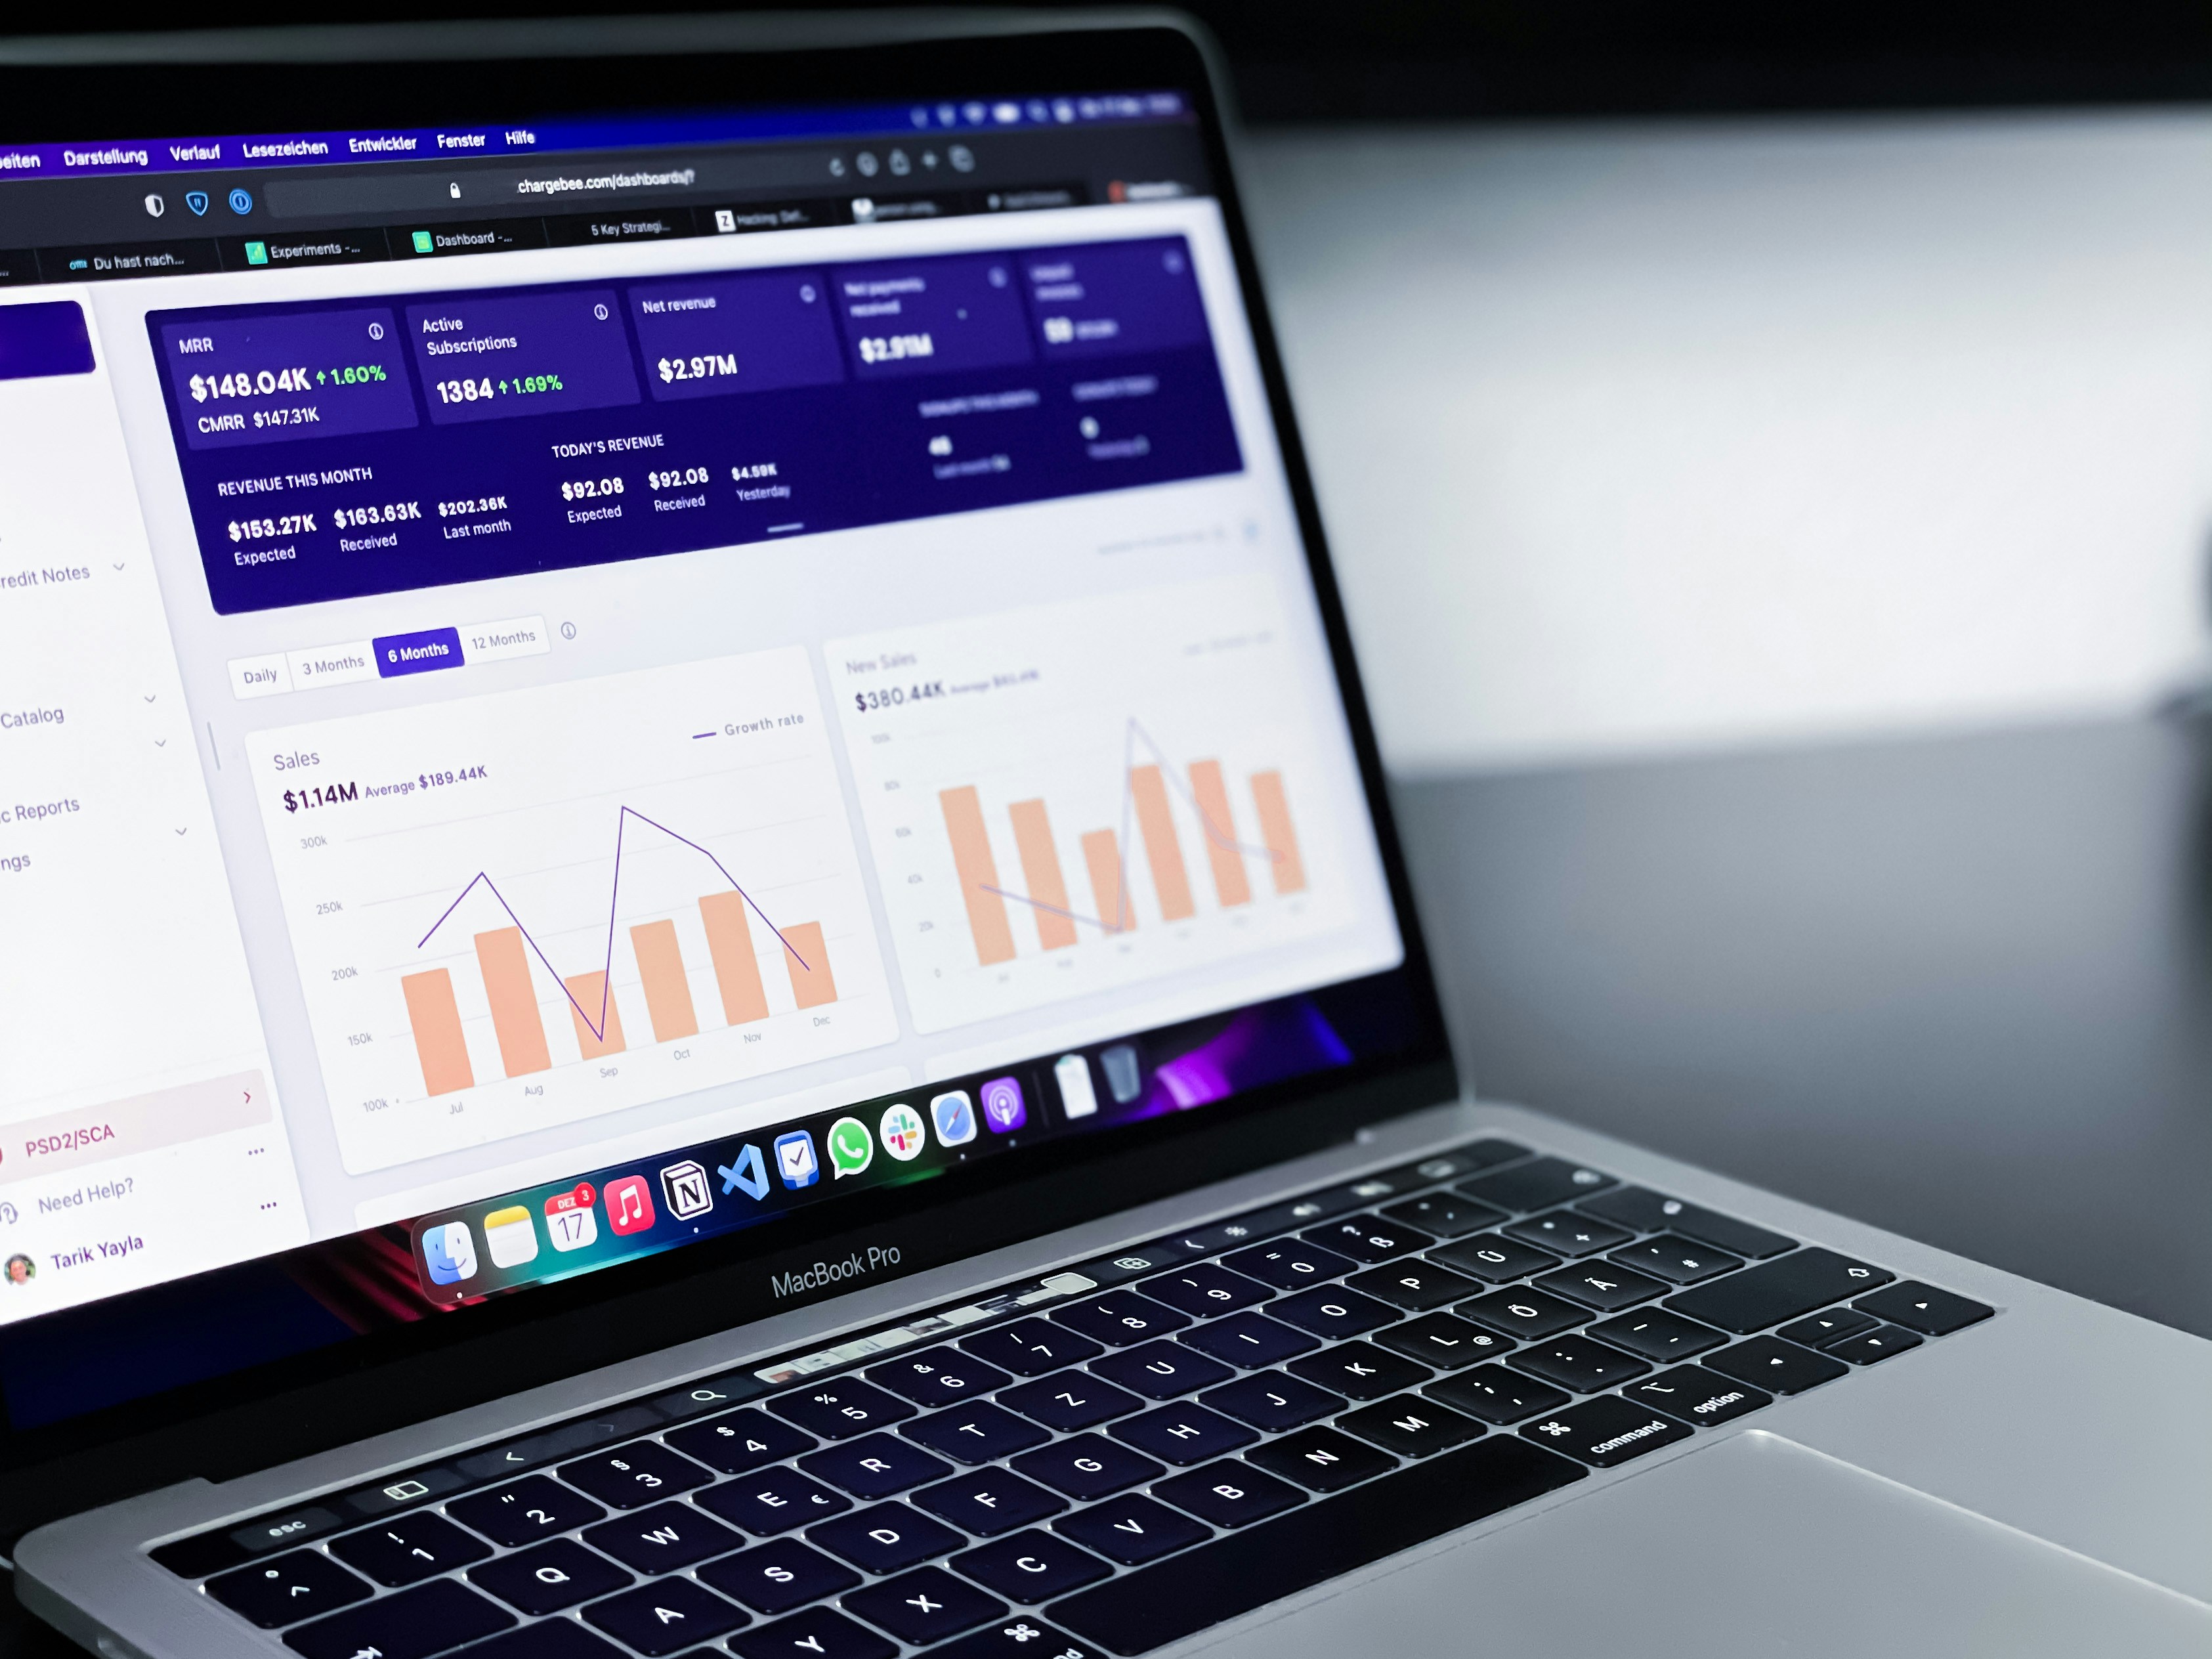
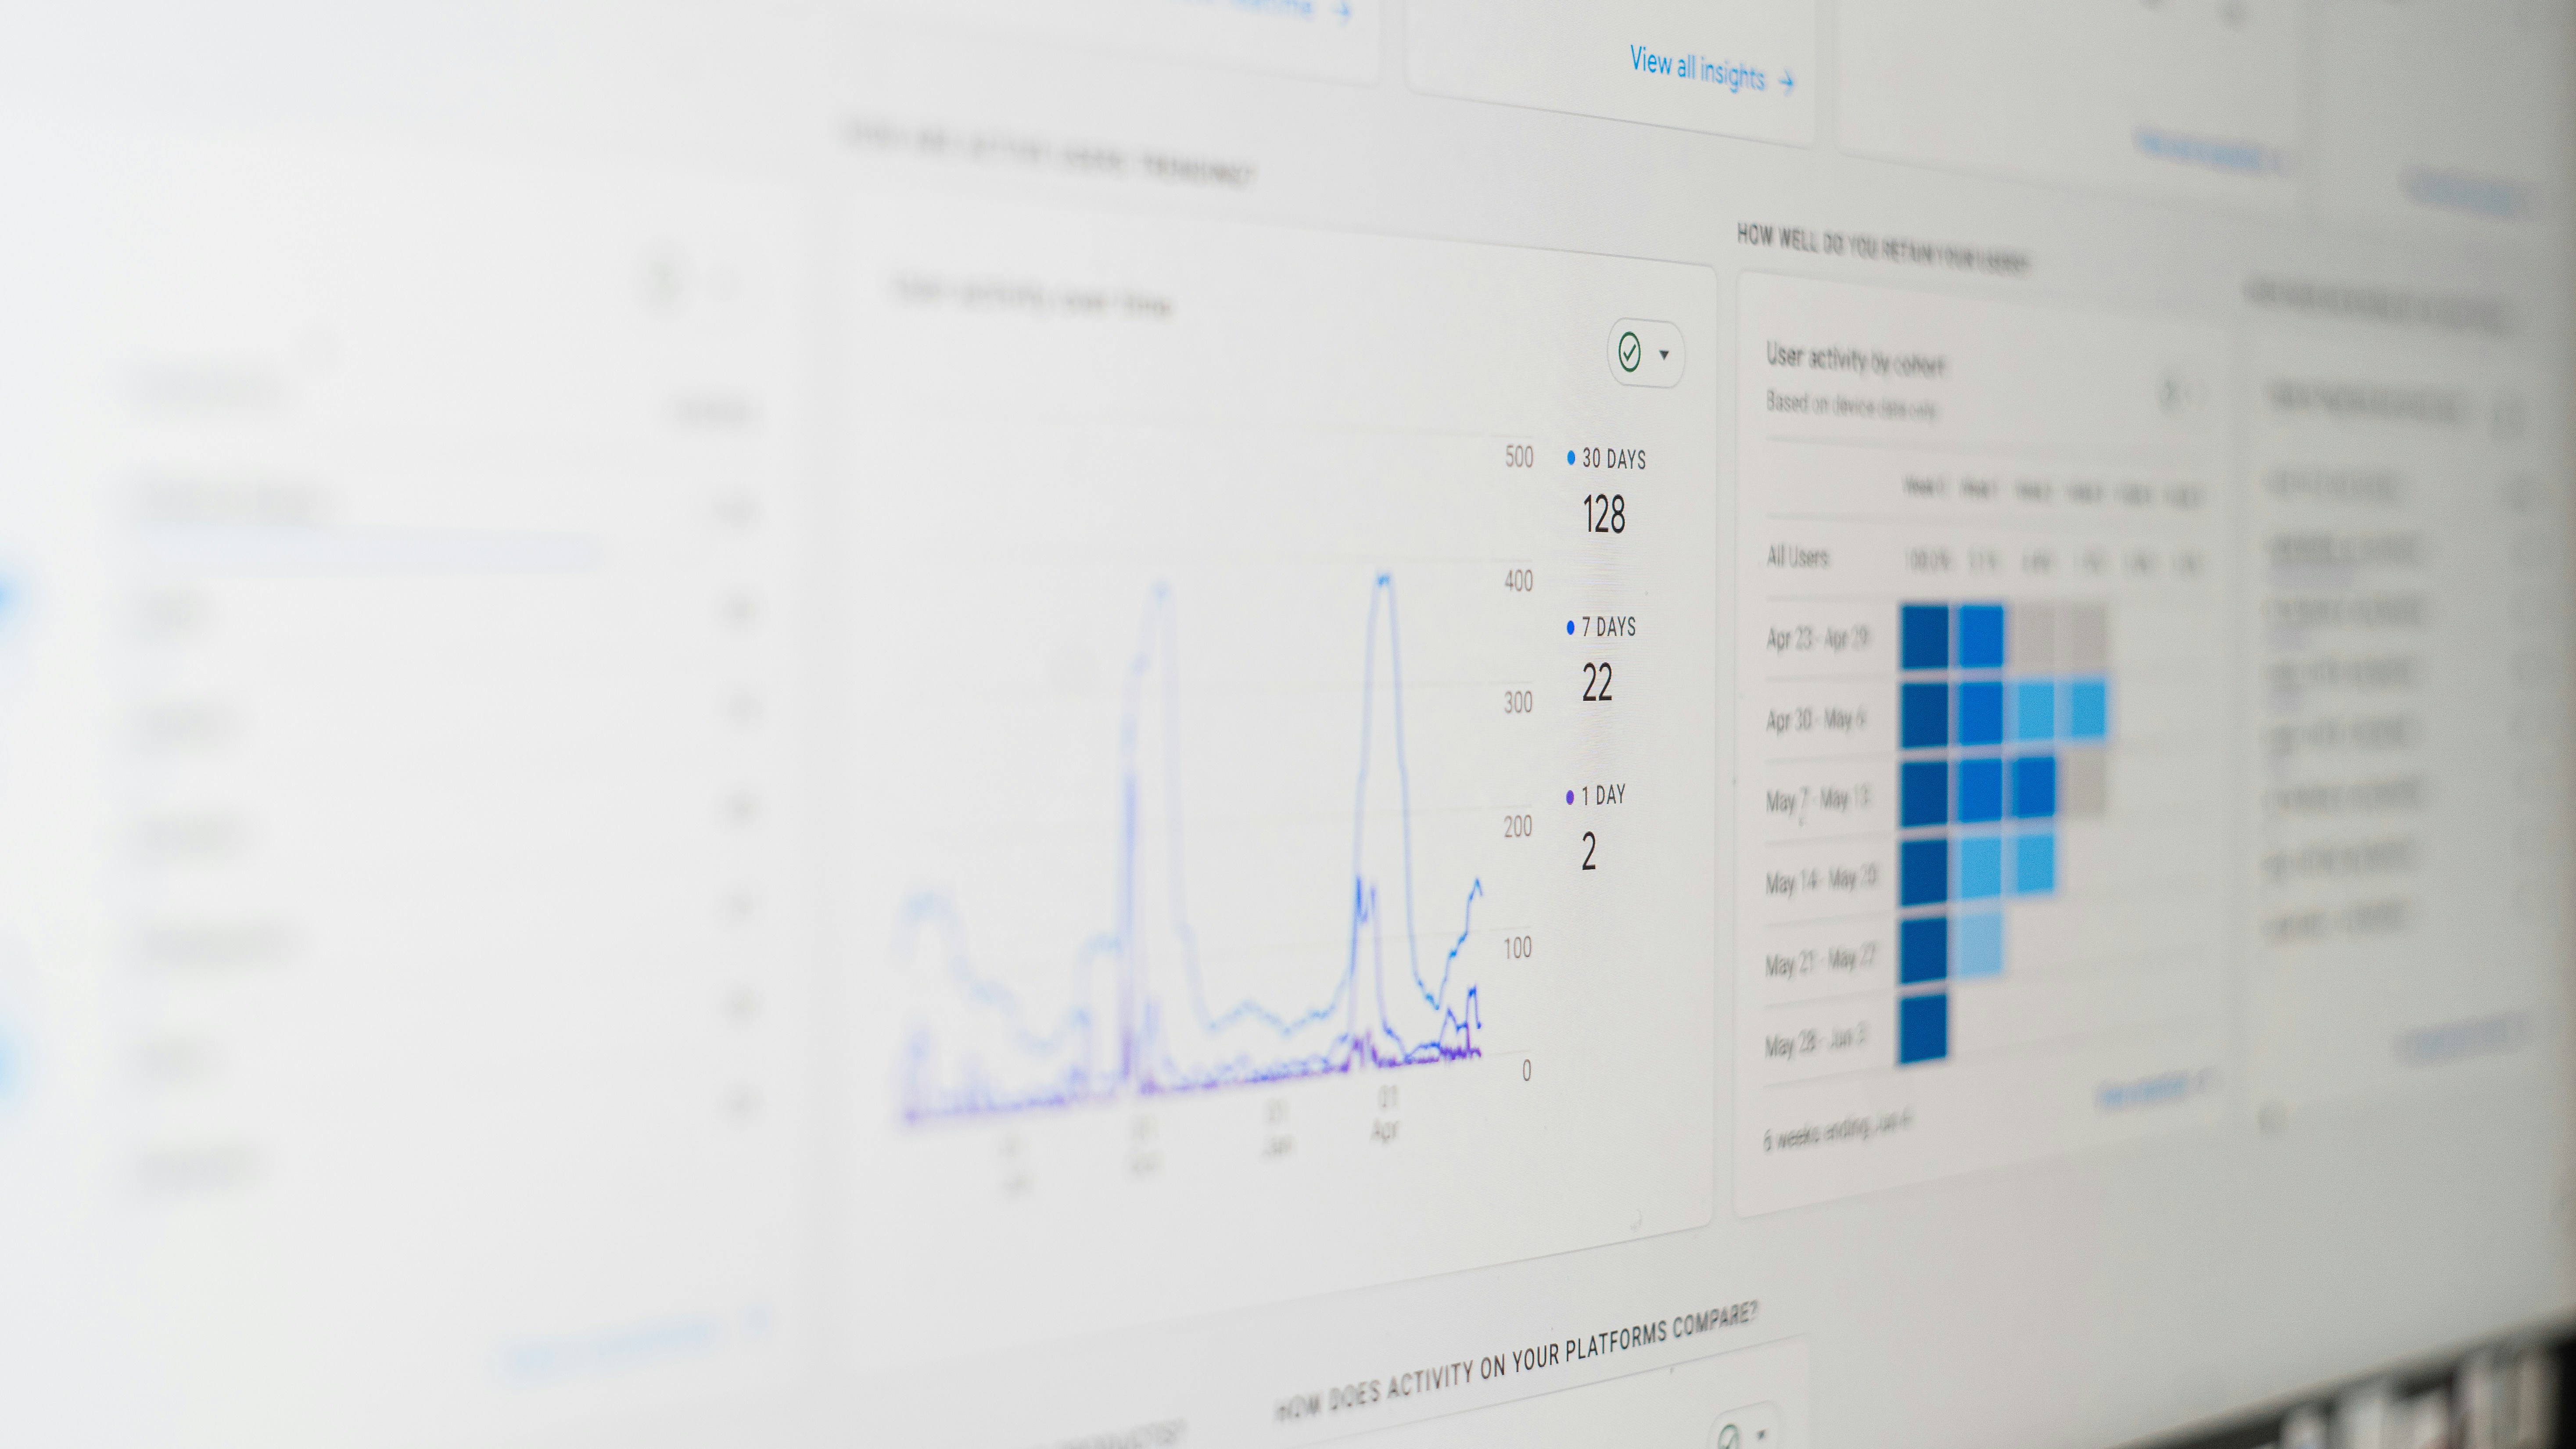
Dashboard Development
We create custom dashboards that visualize data effectively, tailored to meet your specific business requirements.
Our consulting services guide you in implementing effective data strategies and custom software solutions.
Consulting Services
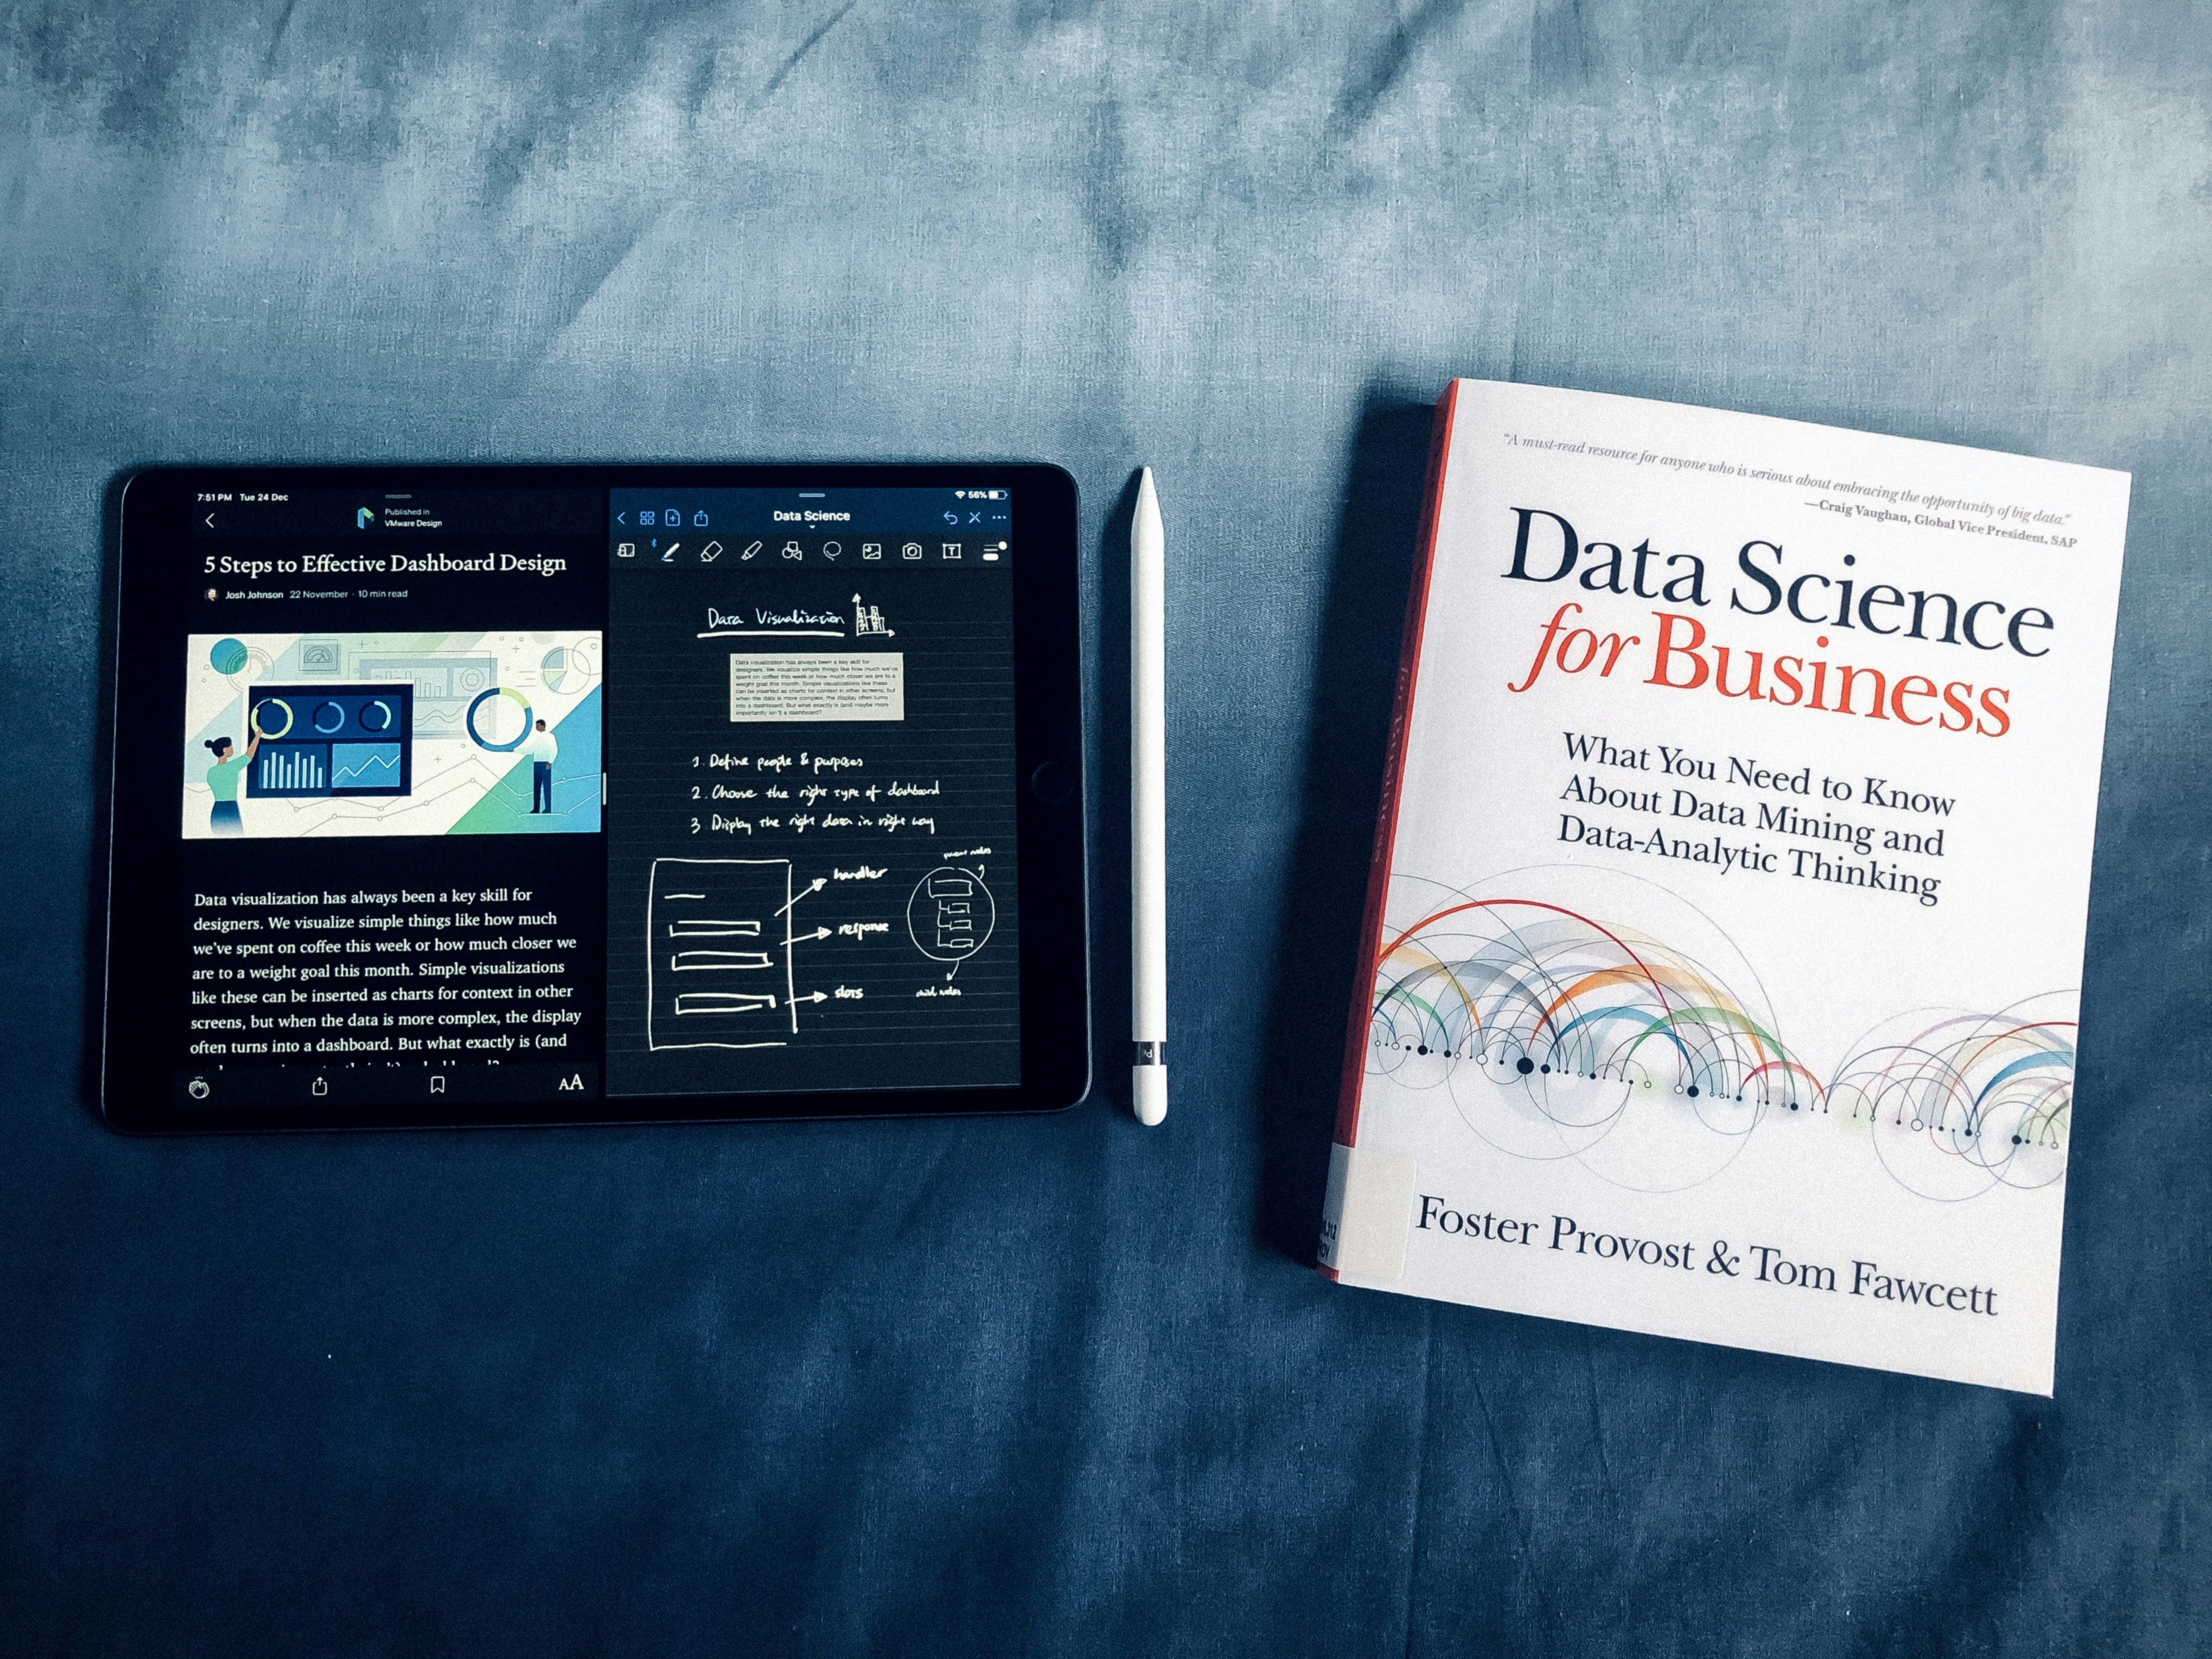
Insight
We create tailored dashboards and analytics for your business.
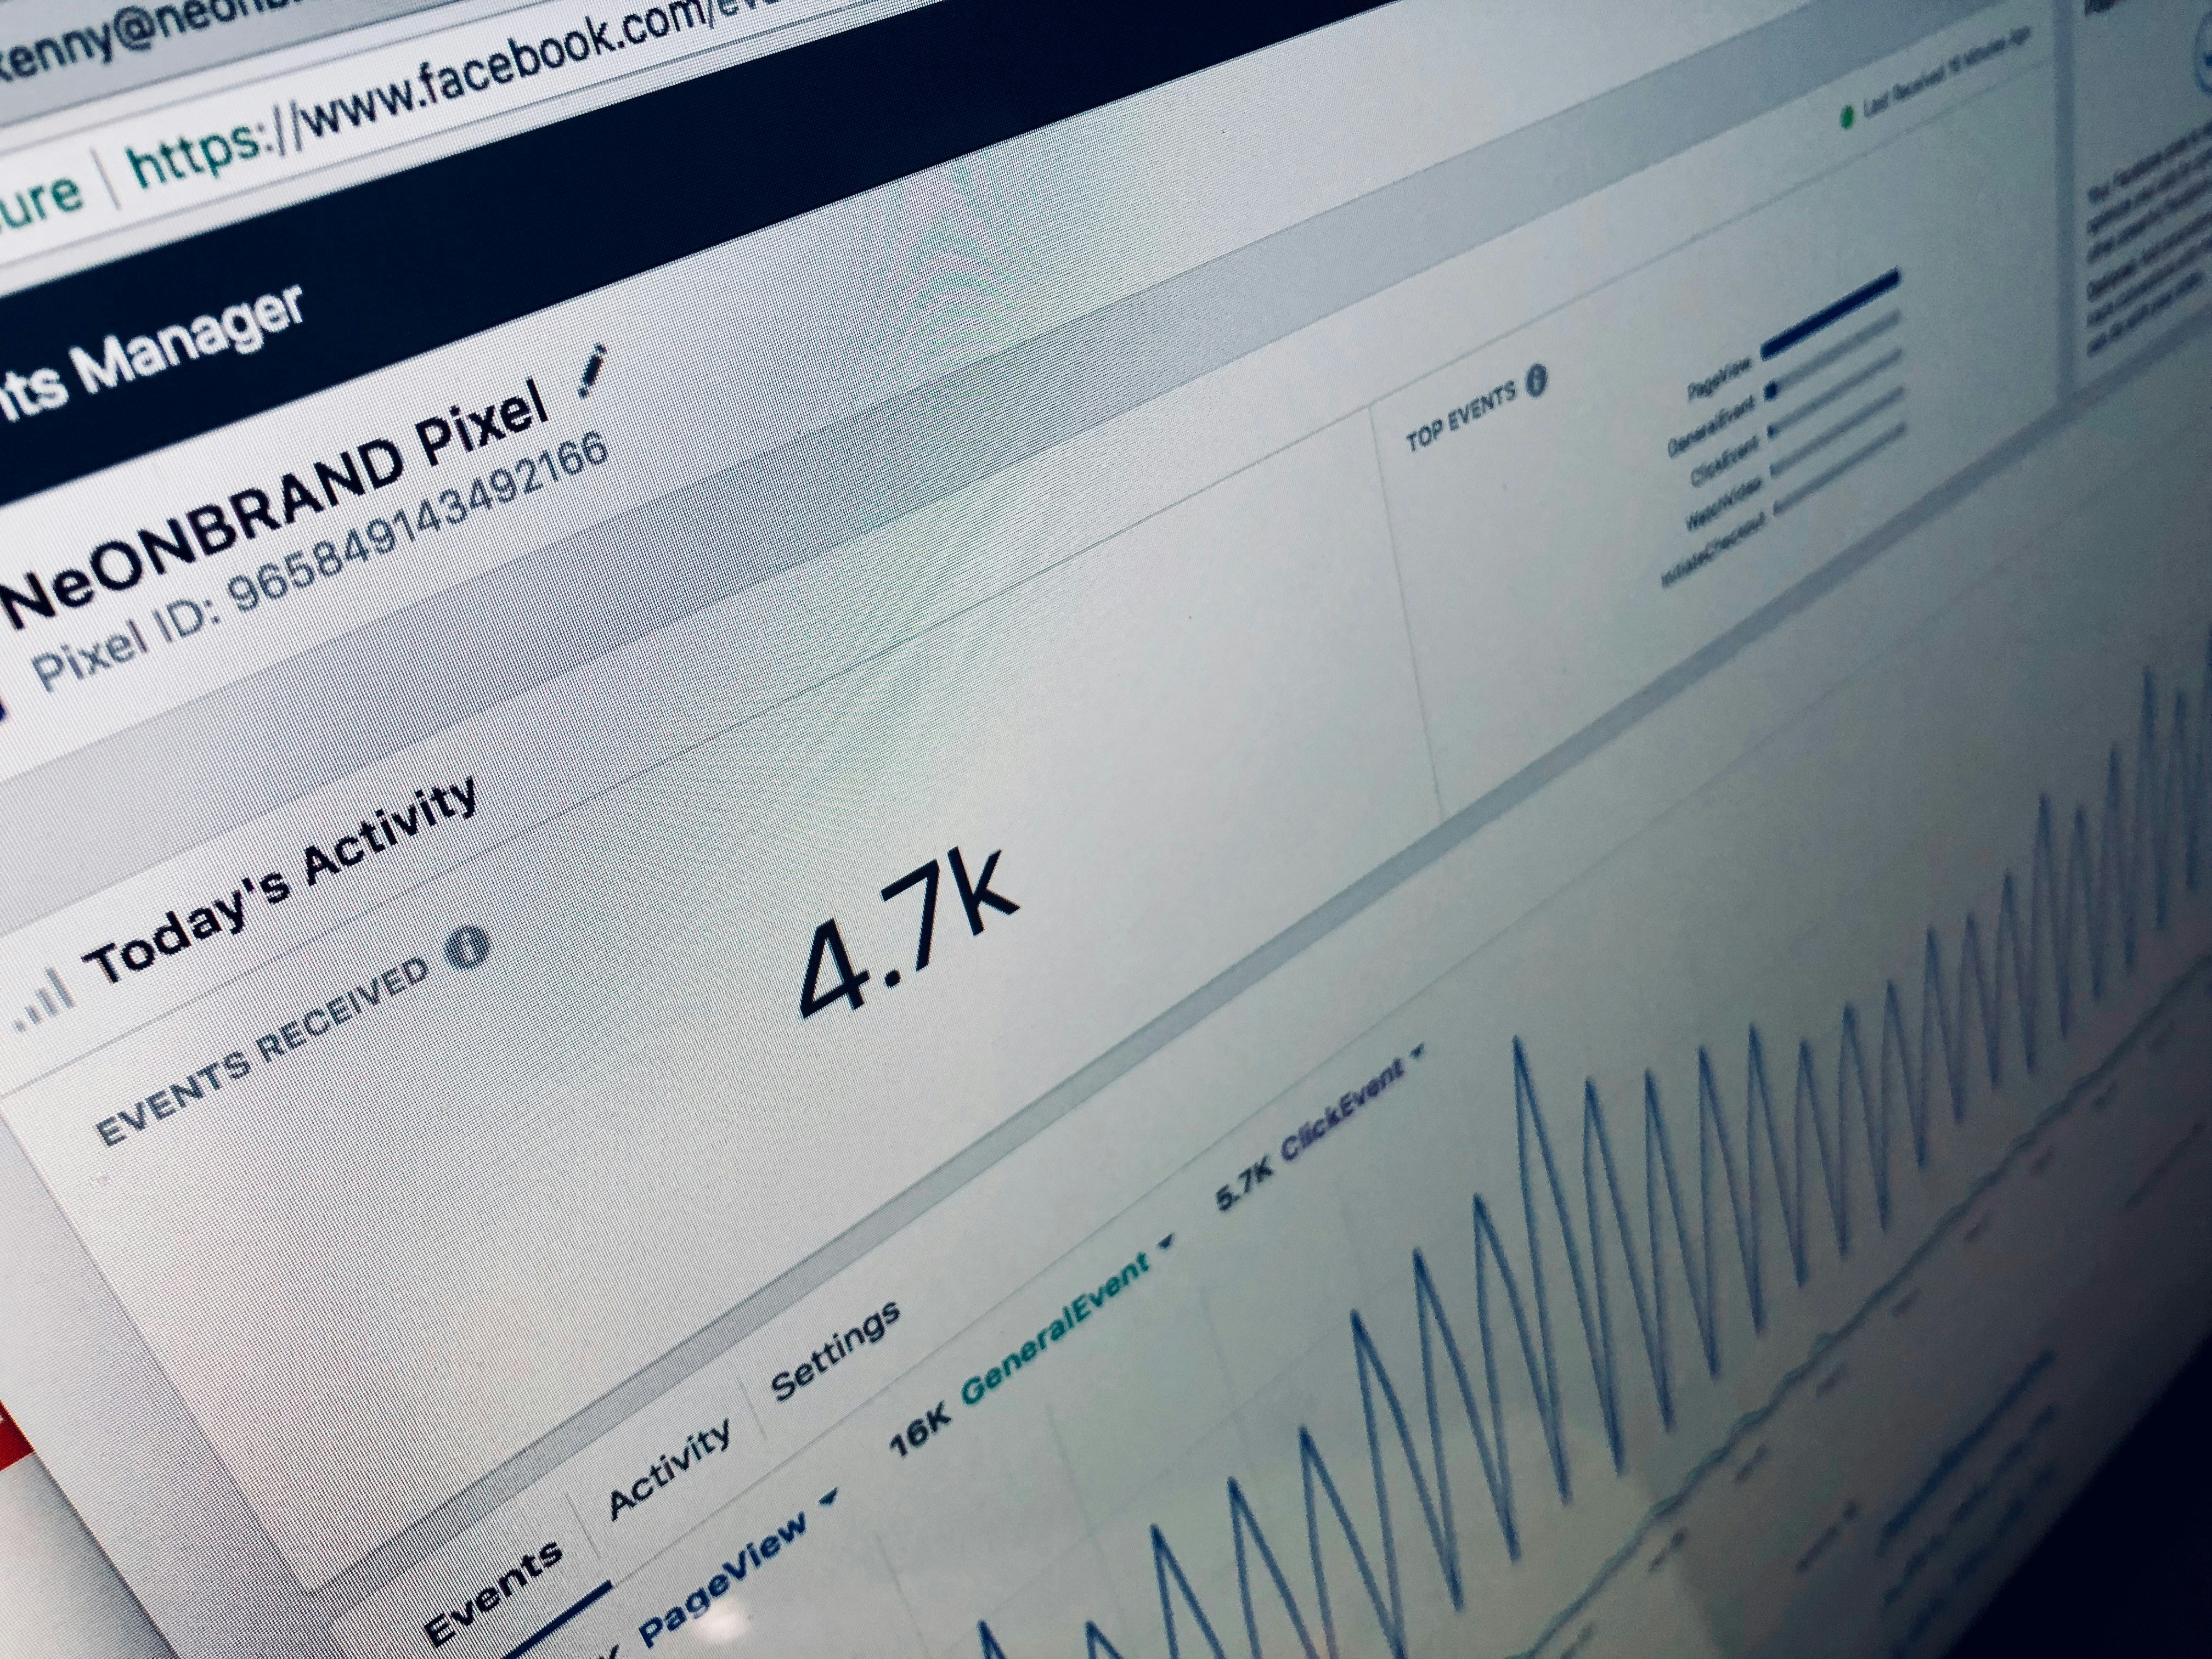
Data Mining
Extract valuable insights from your data effectively.

Business Intelligence
Transform data into actionable insights for decision-making.

Consulting Services
Expert guidance for your custom software development needs.
Dashboards
Visualize data through intuitive and interactive dashboards.→
The custom dashboard transformed our data analysis, making insights accessible and actionable for our team.
Tech Innovators
Their expertise in data mining helped us uncover valuable insights that significantly improved our decision-making process.
Data Solutions